

Exploring the depths of the Canadiens' Salary Cap
Exploring the depths of the Canadiens' Salary Cap
Diving in the Canadiens Cap situation

NHL season has finally started and we can finally hate and be happy together about our favourite sport. On my side, as a Habs fan, it has been a really interesting start of the season. I have seen a few defensive rookies make their start in the NHL due to regular defensemen being hurt… and they did surprise me. Arber Xhekaj used his mean game to become a fan favourite early while Jordan Harris and Kaiden Guhle did good in important situations. Waiver pickup Johnathan Kovacevic also did good defensively in limited 3rd pair minutes. Habs defense still has a lot more to learn to become a “good” defense in the NHL, but I expect much worse from them. Also, as an NHLe model builder, I am making sure to know how good Habs prospects are doing, and I am really happy to see some of them do really good early this season in their respective leagues.
Today, let’s just make a quick analysis of the cap situation for the Canadiens. Let’s start by looking at how teams allow their cap for each position compared to the average. The Z-Score metric shows the distance from the average.

Here we have an overview of how every team of the league is allowing more or less % of their the money they spend on players per position, but we want to focus on the canadiens, so let’s only look at the Canadiens.
Few things we need to be aware of before we go further :
If a player is on IR or LTIR, it will automatically affect the team’s Z-Scores because his cap hit won’t count on the cap the team is allowing for their players. A good example is Joel Edmundson. He is has a cap hit of over 3M$. Since he is injured, the Canadiens’ cap hit data doesn’t care about Joel Edmundson for now, but when he will come back healthy, the team will be spending an additionnal 3.5M$ on defensemen. Proportions for D’s will get bigger (Z-Score too), and proportions at other position will get lower and their Z-scores will be affected. It will also affect the league’s means for proporptions of cap hit% spent on all positions.
So just keep in mind that some teams are dealing with injuries and players out. Data is not perfect here.
So, let’s have a look on Montreal.
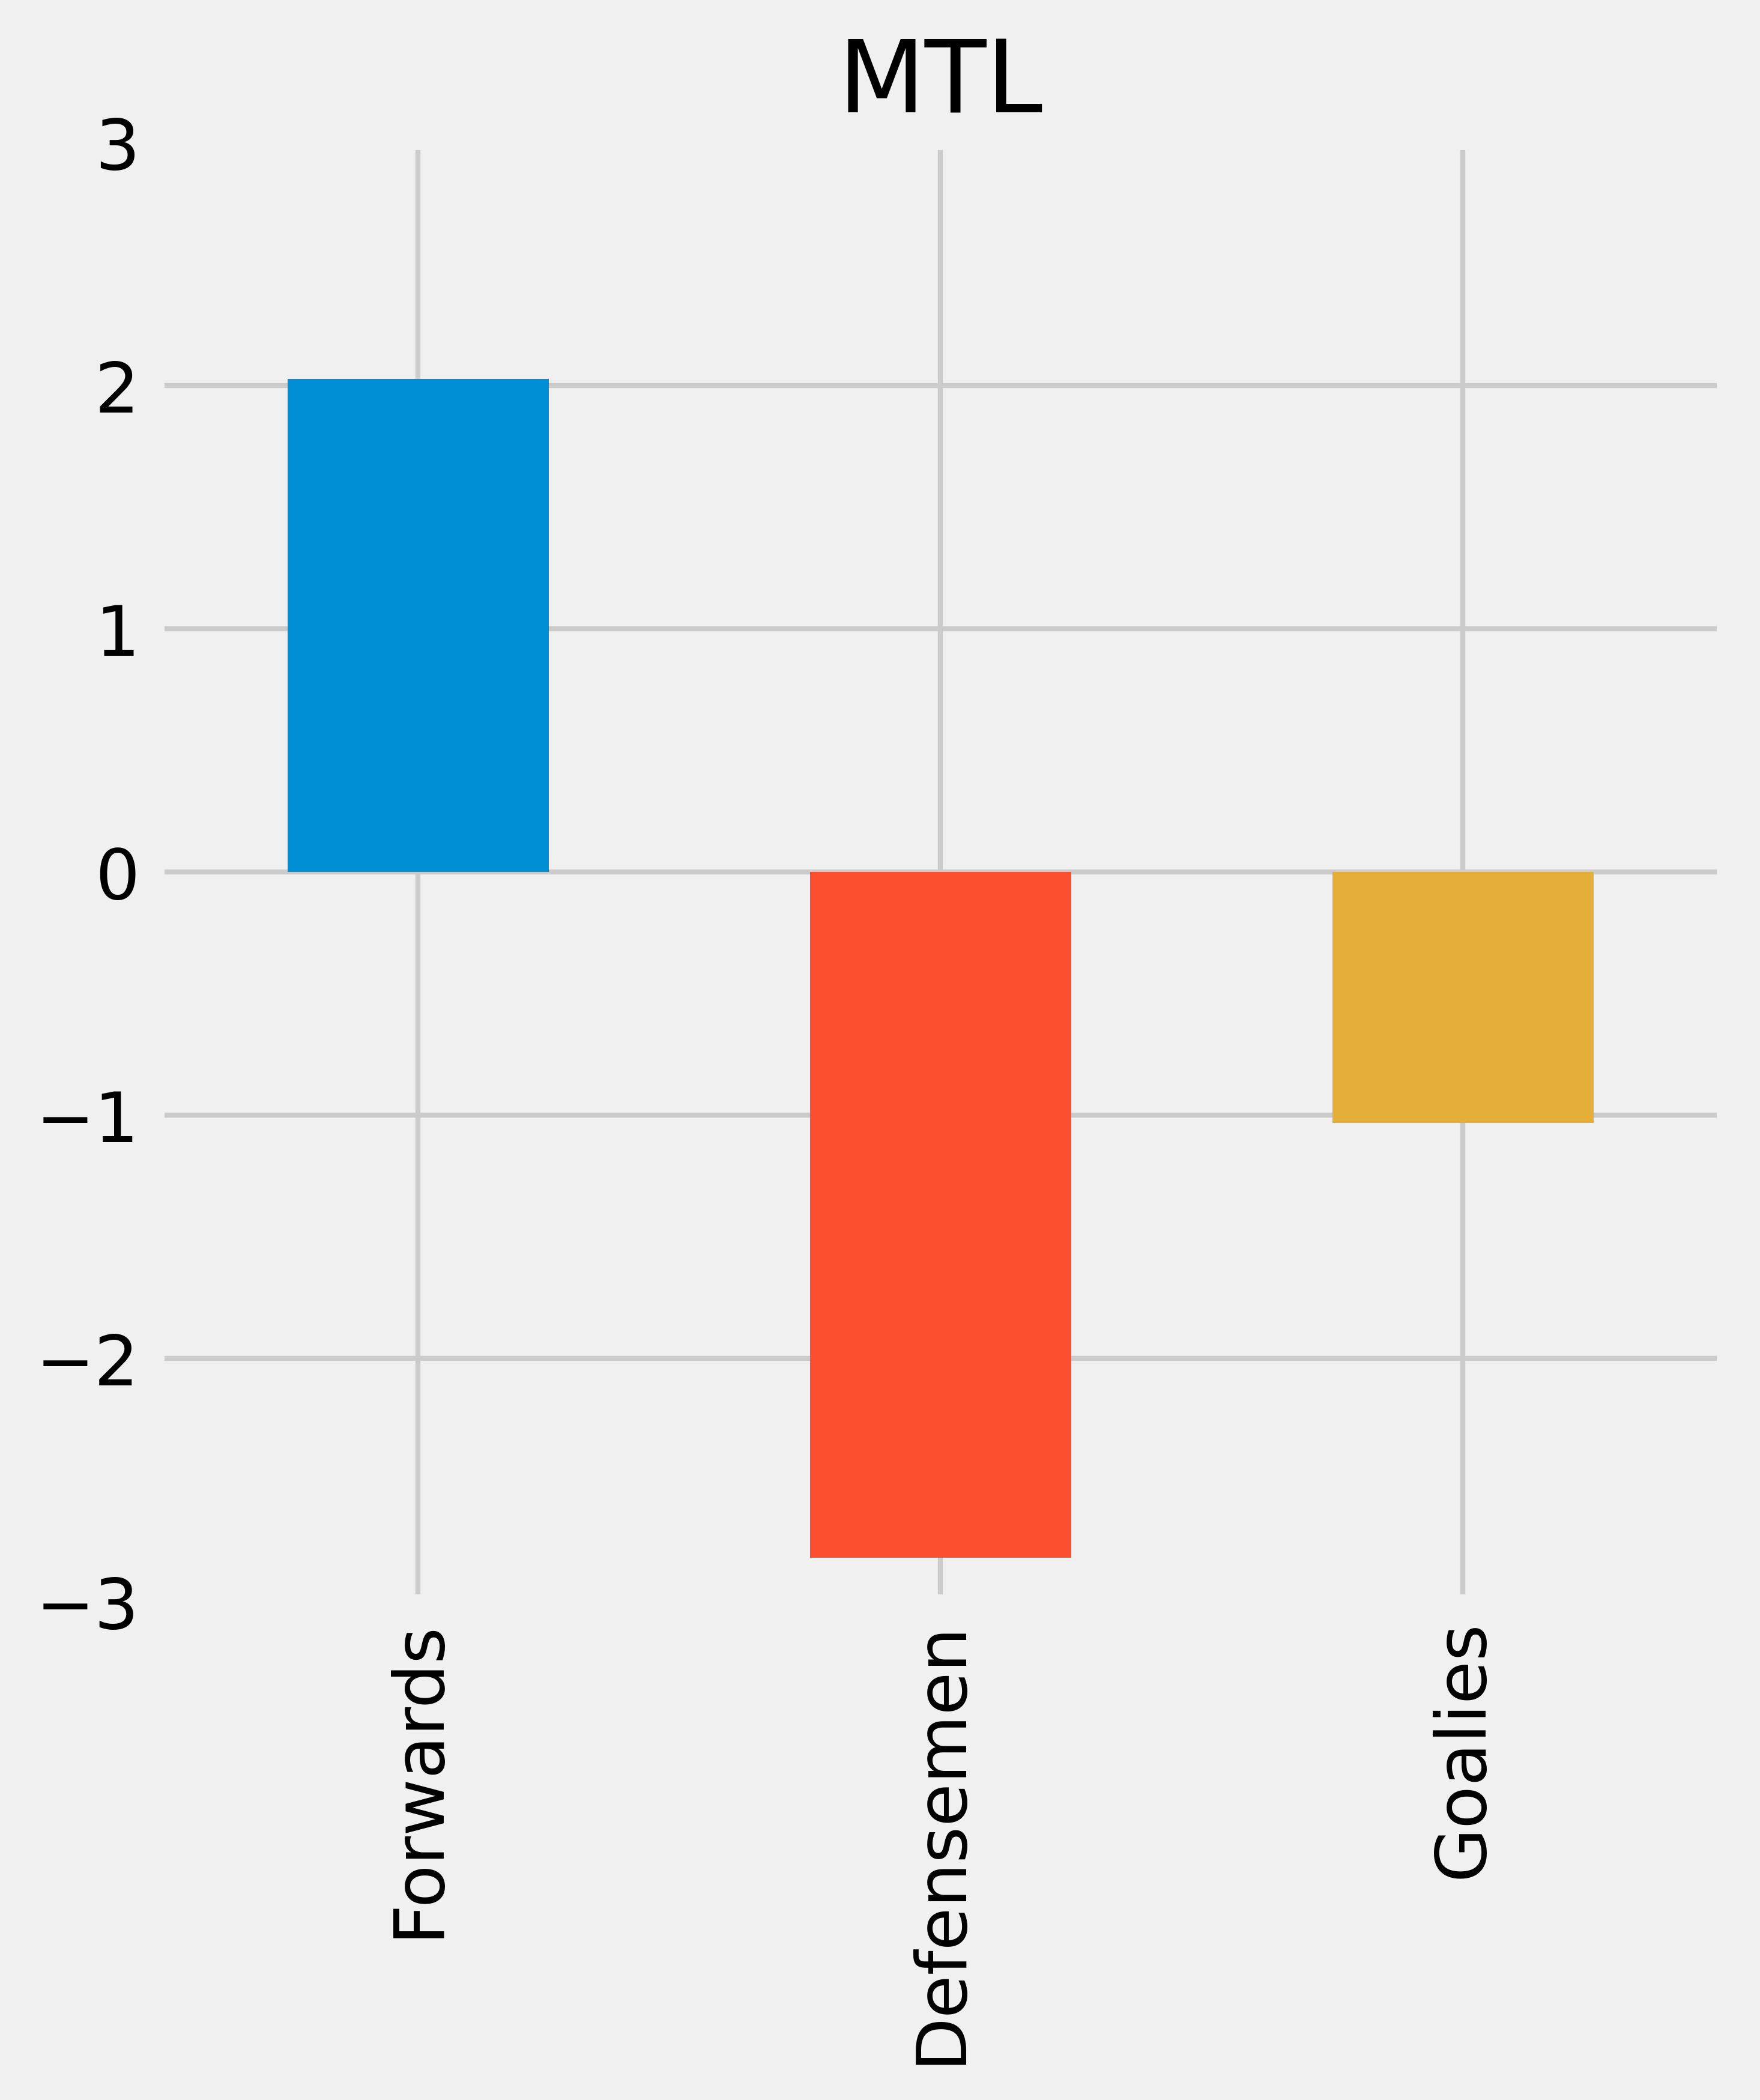
With Carey Price off the cap, their proportion of cap hit allowed for forwards is spiking at 67% and we see it is significantly higher than the rest of the league. With many D’s on ELC or on cheap contracts (because of the injured Mike Matheson and Joel Edmundson), we see that Montreal’s defensemen are not taking a big portion of Montreal’s cap hit. With Price out, Montreal is rebuiliding with a cheap duo of goalies.
If we use money allocated for each position instead of using proportion of cap hit, we would get the same story for Montreal. They are spending a lot on forwards (despite them not scoring a lot of goals), and under the average on defense and goaltending.
If you want to see the cap hit of every player on the Canadiens, consider looking for the information on CapFriendly.com
If you missed it, consider reading my previous article.

Lets’s have fun
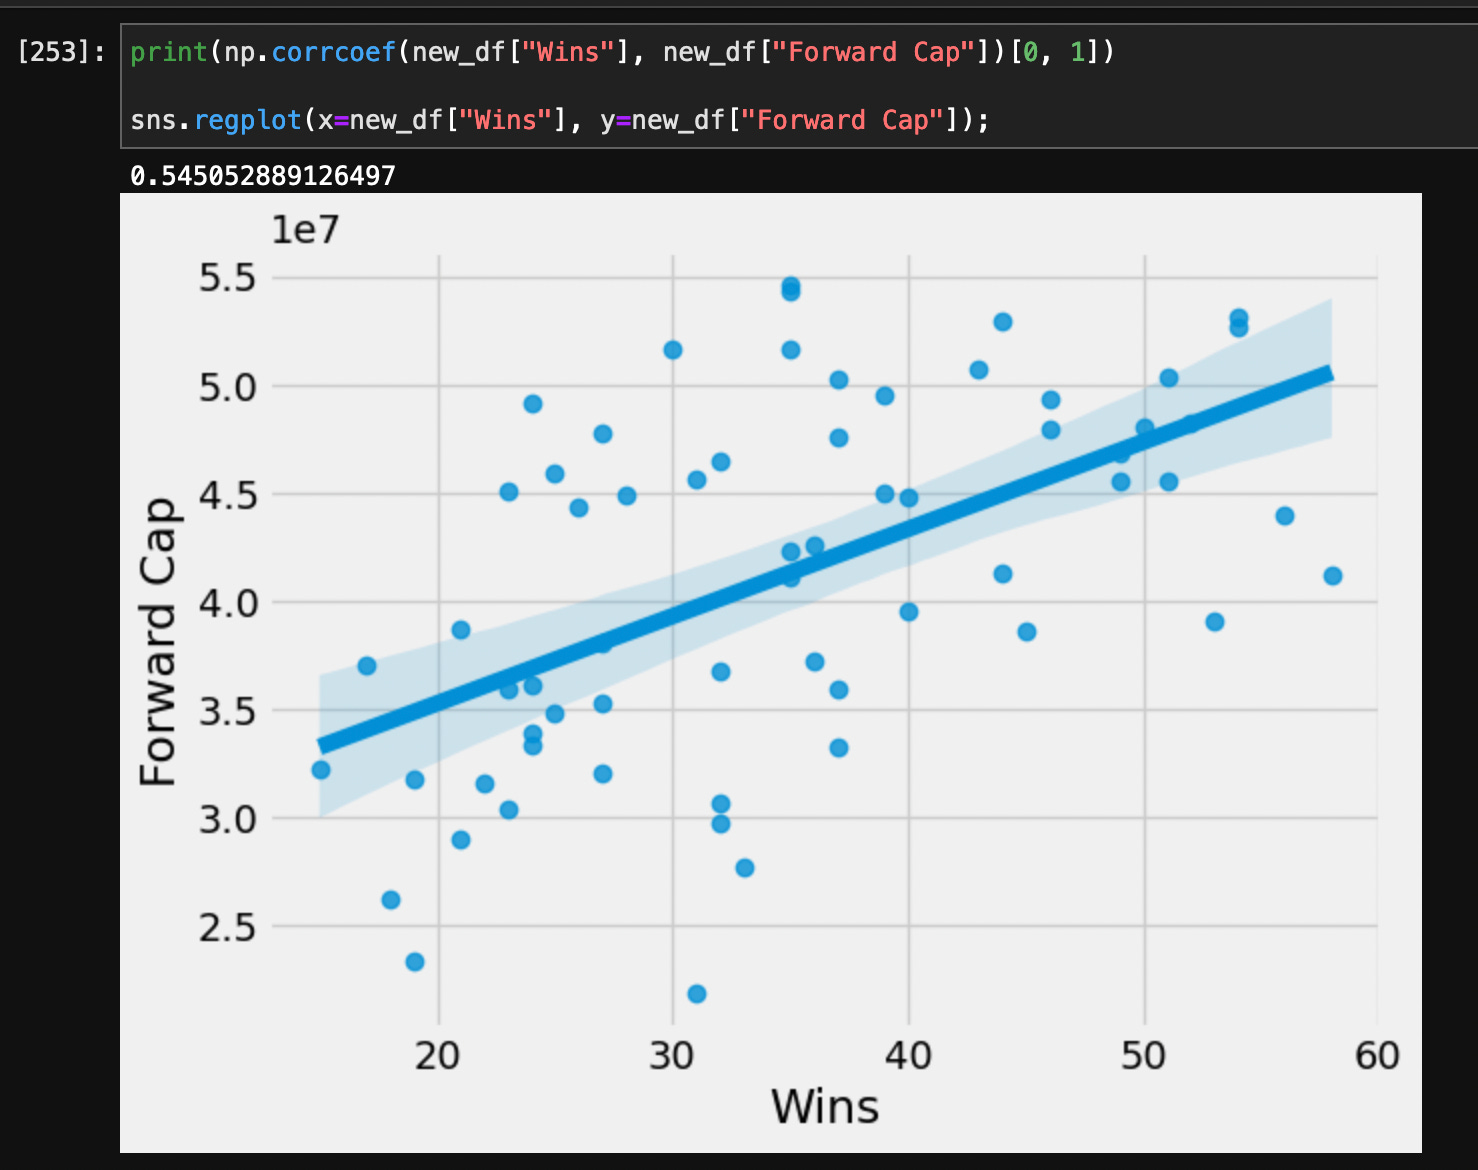
I wanted to know if teams spending more on a particular position were winning more. So, using the data from spotrack, I complied the data from last 2 season and I found out that teams spending more on forward (and allowing more % of their cap hit on forwards) were winning more than the teams who spent less money on forwards.
For fun, using the data from the last 2 season of how teams allocated their money in each position, I built a multiple linear regression model to estimate how many wins a team would get based on their cap allocation per position. The model won’t be perfect, but it is just fun to build models.

Here, the model has an R of 0.59 meaning there’s a moderate positive correlation between real wins and predicated wins of the model… and it is perfectly fine this way for the excercise.

With Montreal’s current cap situation, the model predicts 37 wins for the Canadiens.
Of course, this small excercise lacks of precision. NHL teams salary cap is something that changes every day. Minor events (like recalls and injuries) can have major effects on team’s salary cap and the model didn’t really give importance to this important detail. Also, only 2 seasons of Data is not enough. More data would be more than welcome to build a stronger model.
Finally, Cap allocation itself can’t predict how many wins a team will get, but it is always fun to see different relationships between variables and how they correlates with winning.